
The need for real time information
From sports car to aircraft to super tanker, successful operation depends upon the pilot’s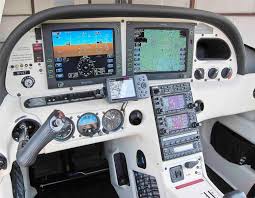 understanding and urgent timely use of a dashboard. Real time information is critical to real time decision-making, and increasingly in the modern business world, decisions are made by management without extended meetings or discussion with others.
Managers need real time information
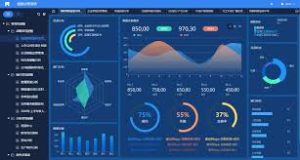
And with the rise of modern technology-driven businesses, the same is true of management in the business world. A good dashboard of relevant real time information is now available for most any business, often created by computer software from data derived from monitoring real time tasks within the business.
Consider these critical pieces of information
 You should consider creating such a dashboard or reviewing the one you use if already driving with one at hand. I’ve developed four criteria for use in creating and evaluating your dashboard. When constructing yours, you should consider the following:
- Controllable outcomes: There is no use for information for which there is no ability to control changes as a result of analysis. Ensure that you include only information for which you have a way to alter future outcomes in a positive direction. An example would be a real time display of the value of the dollar against the yen. If your business has no trade with Japan that could be affected by arbitrage, early shipments or other tactics that take advantage of the moving value of these currencies, that statistic is irrelevant to the dashboard – even if interesting to you.
- Earliest warning metrics: [Email readers, continue here…] What good is information if you can’t act upon it in a timely manner? Find metrics that will be “leading indicators” of trouble to come. Think of labor efficiency (future product or service delivery impairment) or warehouse inventory (sales slowdown, supply chain management problems) as examples.
- Items in the critical path (bottlenecks): This is one of my focus issues for my workshops, it is so important. One of your chief duties is to remove bottlenecks in the delivery process for your product or service, enabling all resources before and after the bottleneck to achieve maximum efficiency. If a critical path machine or employee is slow or down, your own email box overflowing with questions from subordinates needing answers, or any other measure of critical path impairment in need of fixing, you should know about it at the earliest possible moment. Add a measure of each that you identify with to your dashboard.
- Items impacting cash (now or later): Cash is the oil of your business. Slowing of production, deliveries, raw materials, receivables collections, billing for work completed – all are going to influence cash flow soon and should be tracked when out of expected range.
Some simple indicators you can track
Simple indicators that affect multiple areas above include increasing backlog, call center  delay time denigration, increases in finished goods inventory amounts, unbalanced work in process inventory buildups, and reduced efficiencies in billed time for consultants or experts.
And how about projecting cashflow?
How about projecting cash on your dashboard: cash on hand plus expected accounts receivable collections subtracting necessary accounts payable payments and payroll. You will find many more candidates for your personal dashboard. Try to limit yours to five or fewer critical measures that can be updated no less often than daily if not in real time.
You will be steps ahead of most of your competitors and in a much better place to succeed if you create and maintain an effective dashboard.